A few weeks ago I took a break from the virtual world and attended a live conference of performance excellence-minded professionals. In one workshop, I discussed gap analysis and some techniques for getting to the gap drivers. Because of the high-level of interest, I thought it would be helpful to share them now.
Where to Start
Before breaking down a gap, one must be sure that the gap is credible. This requires an appropriate measure, documented performance, and a valid required performance level, or “target”. These were the topics of previous posts, so I won’t delve into them here.
Gap analysis is a process; therefore, we can describe it in a series of systematic steps.
Step #1 : Identify the System or Process of Interest
Measures represent the results created by a process. Therefore, to change the measured outcome, one must change the elements and interactions of those elements within the process. Depending on the measure, you may need to tackle a system or a specific process within the system. For example, If the outcome measure is “Annualized Workforce Retention Rate” you may decide to address the Retention System, or, you may decide to address the “Onboarding Process” within the Retention System. Data and a reasonable prioritization method (i.e. Selection Matrix) can indicate which level and approach you should choose. One approach I use often is to study hiring data and calculate where the candidate/employee drops out (run-off) between the initial recruiting contact, through hiring, probation, and the first annual anniversary. For example, if 60% of the recruits are converted to new-hires, but only 25% of the new hires survive the 90-day probationary period, that could be a promising process/area to analyze.
Step #2 : Understand the Process
Before crunching numbers, it’s imperative to study the process in question and learn more about it than anybody else. Others may have expert knowledge of particular fragments of the process, but few will know the “end-to-end” process. Flow charts, Gemba Walks, and 8 Wastes analysis with SMEs can help you assimilate diverse knowledge and quickly acquire the necessary expertise. Although subjective in nature, you will acquire insights which will help inform your data collection strategy.
Step #3 : Collect the Data You Need
Many analysts fail at this point because they settle for the data that’s available instead of first determining the data they need and then collecting that. One way to create a data collection strategy is to look at the gap from the four problem perspectives (4 Ws) – “what, when, where, and who”. You already performed “how” in Step #2, and you can’t do “why” until you’ve identified the problem. The problem is also called the “effect” in Cause and Effect analysis, and the “why” is the cause. An approach that can be used here is to create a 4-quadrant grid labeling each one with a different “W”. For example, for the “When” quadrant, you could explore anything to do with time, such as the time between hire date and termination date, the probationary date they terminated, time from offer to start date, month hired, shift worked, etc. Then do the same for the other three Ws. Don’t be surprised when you generate a list of 20-30 perspectives. Start your analysis by using the team’s expertise and analyze what appears to be the “most likely “problem. If this doesn’t pan out, select the next most likely. The tools you’ll be applying here are the histogram and Pareto chart. You’ll be amazed to find that when a gap’s sample data is analyzed from the four perspectives using Pareto charts, all four Paretos will have different shapes; however, one will reveal the most significant problem. That’s the one you’re looking for. For example, let’s say you’re dissatisfied with the monthly defect rate gap and you decided to collect a sample of 85 defective parts and apply the 4Ws technique. Pareto analysis of the sample produced the following four Pareto charts.
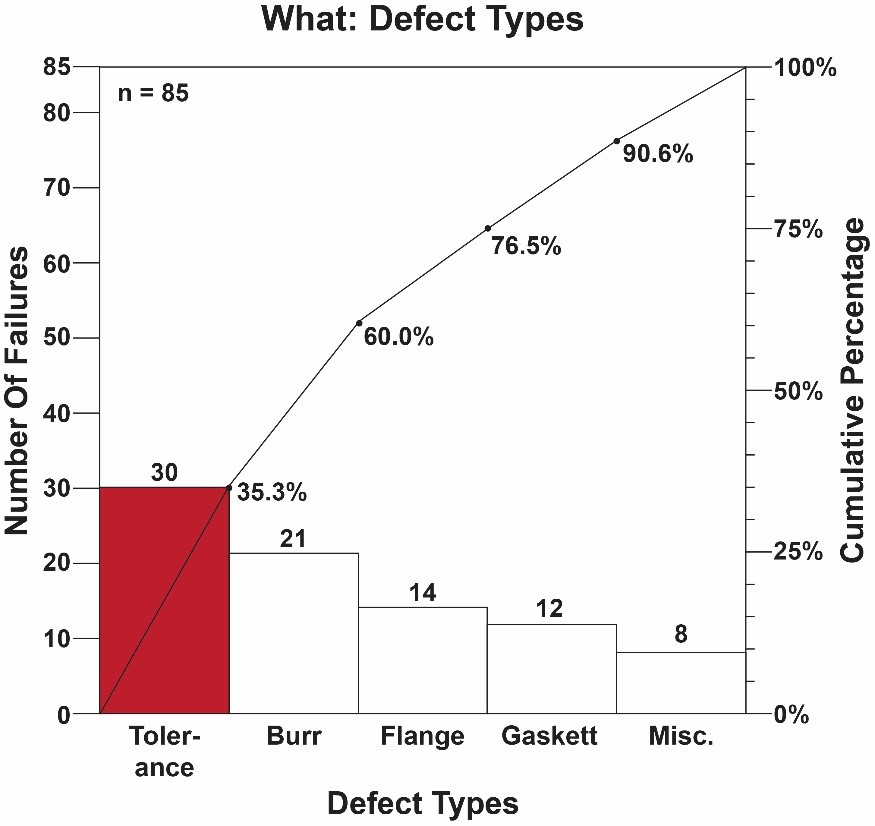
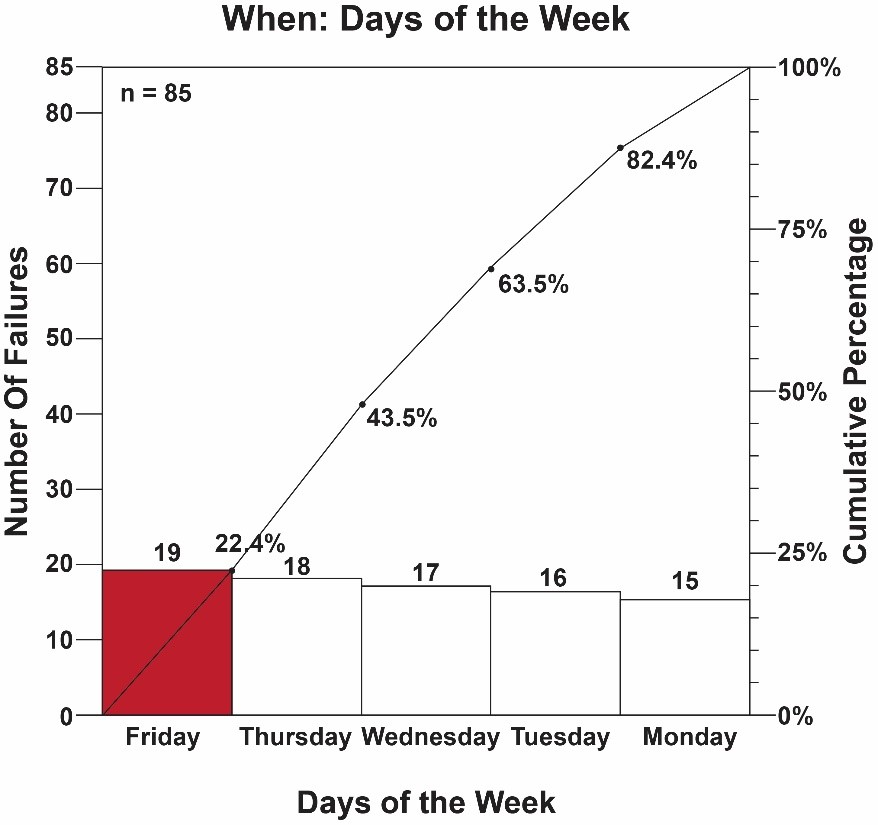
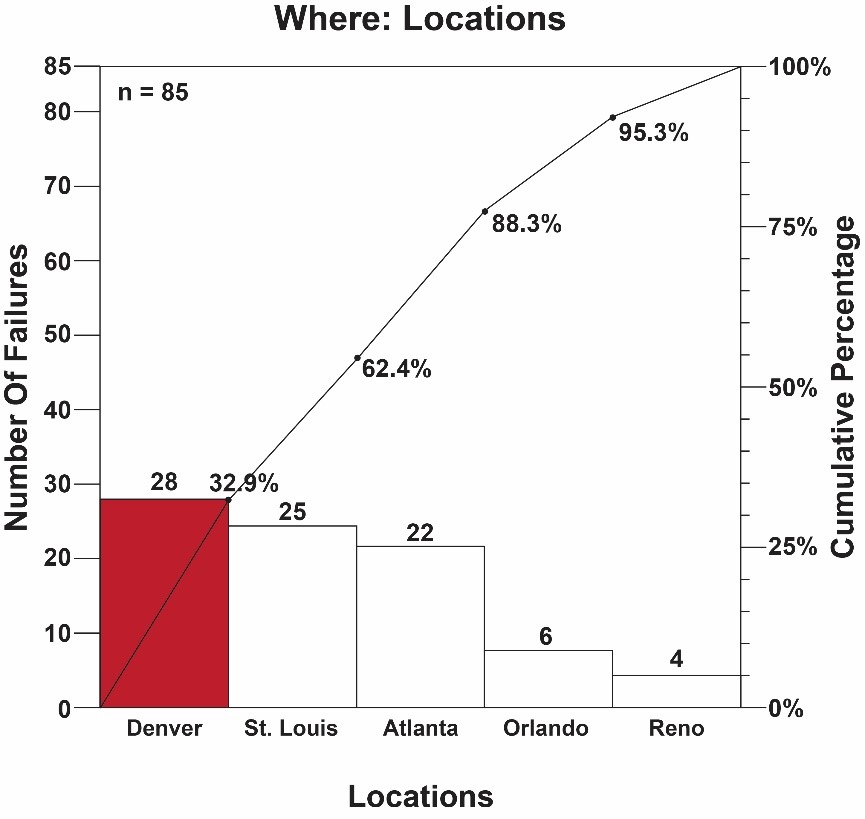
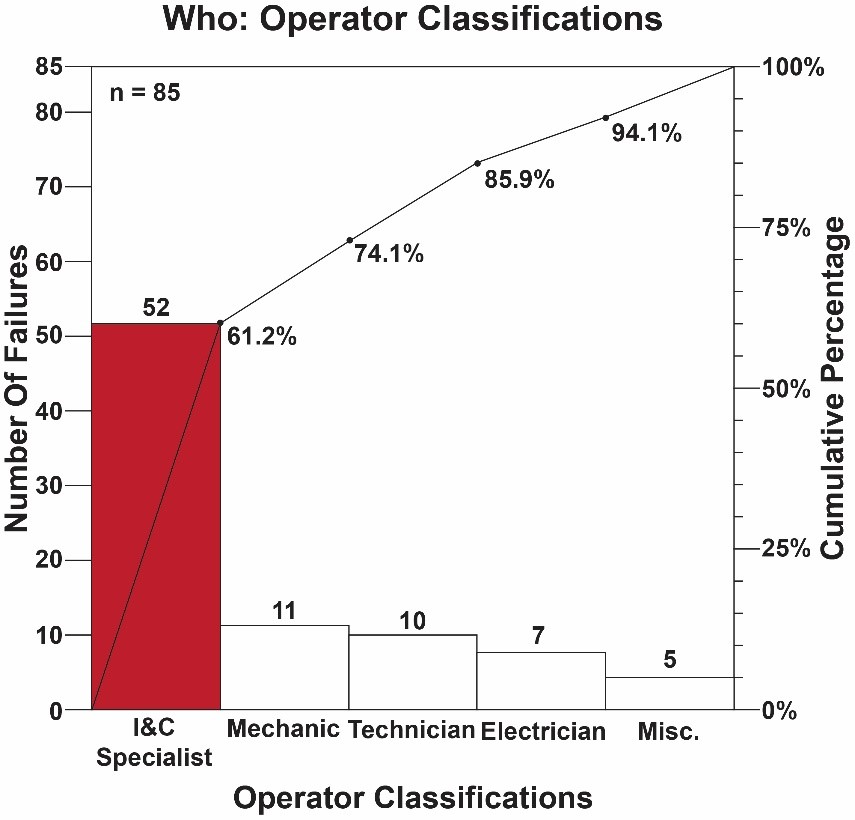
The “Who” perspective produced a problem which accounted for 61.2% of the gap, much more than any of the other three perspectives. Conclusion: The same sample analyzed from different perspectives reveals different problems, but one will be more significant than the other perspectives.
Step #4 : Create a Problem Statement
Let’s assume we have a KPI for the “Percentage of Products that Meet Customer Requirements”. The Problem Statement will focus your efforts on the problem driving the KPI’s gap. The SMART framework is beneficial for doing this. Using the above Pareto chart example, a SMART Problem Statement would be : “Reduce the number of I&C Specialist-related defects from 52 per month to 10 per month by October 31, 2022, thereby reducing the KPI gap by 2 percentage points”.
Summary
Gap analysis is a process. The gap must be credible, and examining the gap from the four perspectives will reveal a significant problem. Conclude your analysis with a SMART Problem Statement. Don’t settle for the data readily available, determine the data you need. Remember, most organizations collect data to ensure compliance to regulators’ standards so they can remain in business. The data you need is different. You’re thinking beyond compliance. You are striving for performance excellence through improvement and innovation.